Study Shows that Protected Bike Lanes are a Must
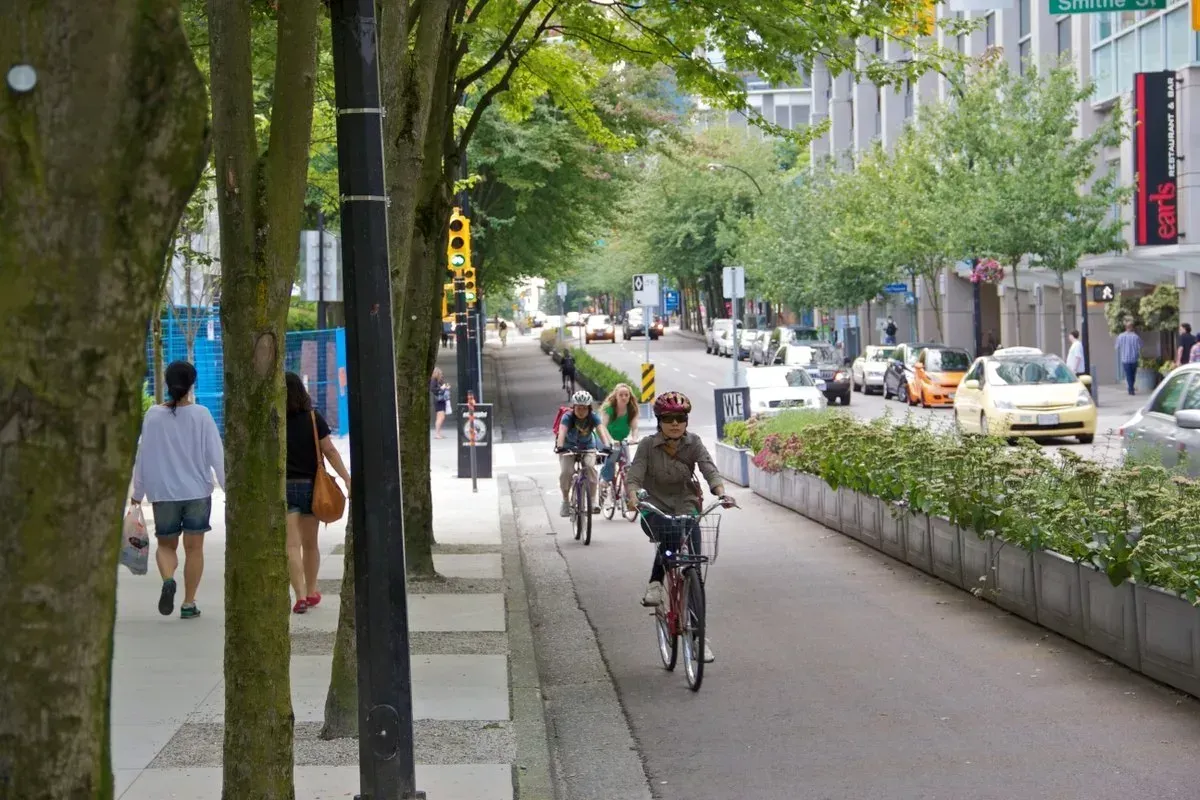
Let me first say, DUH. At the same time, it’s good to have some solid evidence to slap those who claim otherwise in the face with. Especially if they are the ones in charge of infrastructure. Providing cyclists with bike lanes protected from vehicle traffic (a coat of green paint doesn’t count) is an infrastructure must. In fact, a study from Monash University in Australia suggests that merely painting bike lanes onto the roads may be counterproductive.
Researchers conducted an observational study, in which cyclists were equipped with sensors and cameras to capture data during their rides. Satellite navigation was used for location tracking, ultrasonic sensors were used to measure the passing distances of objects as the cyclists rode, and cameras allowed the researchers to classify events. Over the study period the cyclists made 422 trips covering a total of 3,294 miles (5,302km).
From that data set researchers identified 18,527 instances where a vehicle overtook a cyclist. Of these passing events, 1,085 happened with less than 39 inches’ (100cm) passing distance between bike and vehicle. Most of the passes occurred in areas with 37mph (60km/h) speed limits where average passing distance was 75 inches. Passing distances decreased in areas with lower speed limits (66 inches in 40km/h zones, 67 inches in 50km/h zones).
Astonishingly, drivers got closer (60 inches) to cyclists when passing in 62mph (100km/h) zones.
Here’s the real kicker. On average, cars left 10 inches less room when cyclists were using painted cycle lanes. They left 12 inches less room when there were rows of parked cars along the curbs. And 15.7 inches less room when a road had both parked cars along the curb along with a painted cycle lane. (
More evidence that in the absence of a properly protected bike lane, you’re best off taking the lane entirely. Other studies have shown that people will tend to actually change lanes to pass, as opposed to squeeze you if you do so. See figure 5 and figure 6 in this study for a great visual of the effect.
Accident Analysis and Prevention, 2019. DOI: 10.1016/j.aap.2019.03.007


